KANO
7 min
6+

You cannot build everything at once (and you shouldn’t). Instead, you want to build a roadmap with the right features. But which are the right features?
Fortunately, the KANO model helps us to find an the answer. We’ll briefly explain what it is and provide a step-by-step guide to apply.
How does KANO work?
1. Satisfaction vs. Functionality graph
KANO proposes two dimensions on which to map features.
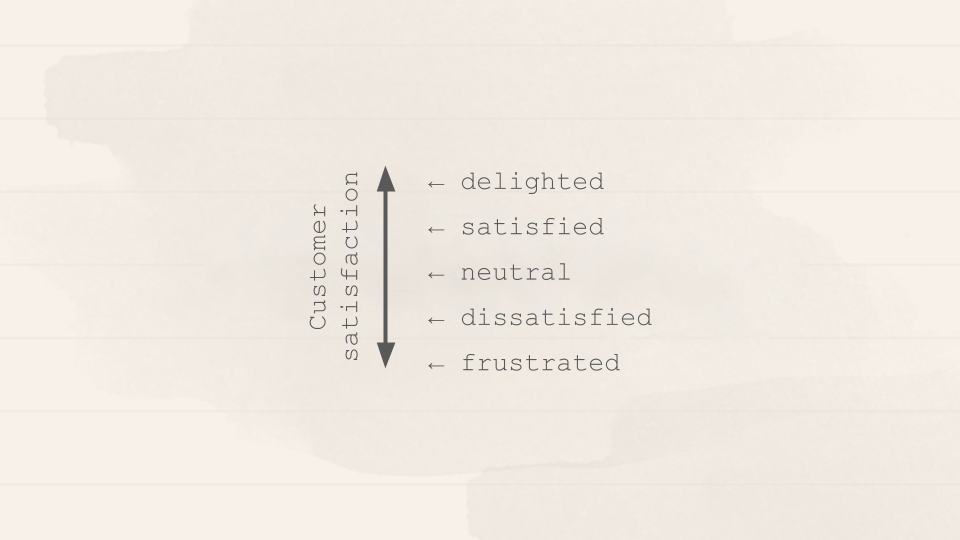
Dimension 1 (and your goal): Satsifying your users. This dimension goes from total satisfaction (also called Delight) to total dissatisfaction (or Frustration).
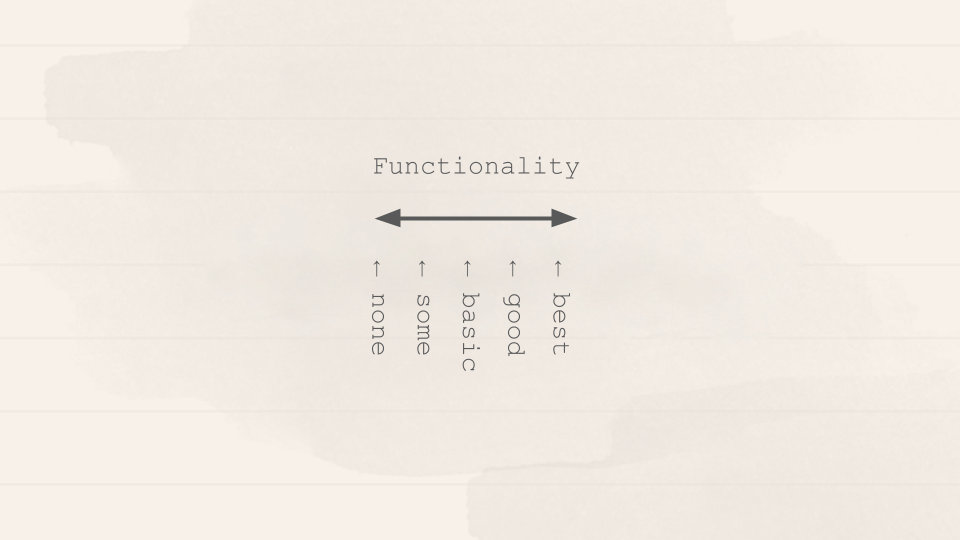
Dimension 2: Functionality. (Also sometimes called Investment, Sophistication or Implementation.) It represents how much of a given feature your user gets, how well you’ve implemented it, or how much you’ve invested in its development.
2. The four categories of features
On this graph you can map features according to how your customers react to the provided level of Functionality. Your features can fall into one of four categories.
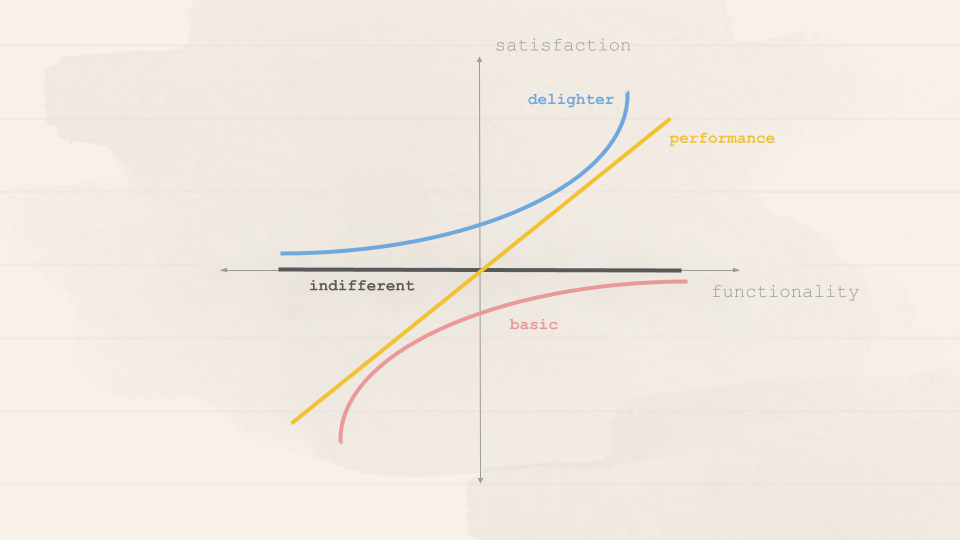
Delighters
There are unexpected features which, when presented, cause a positive reaction. These are usually called Delighters.
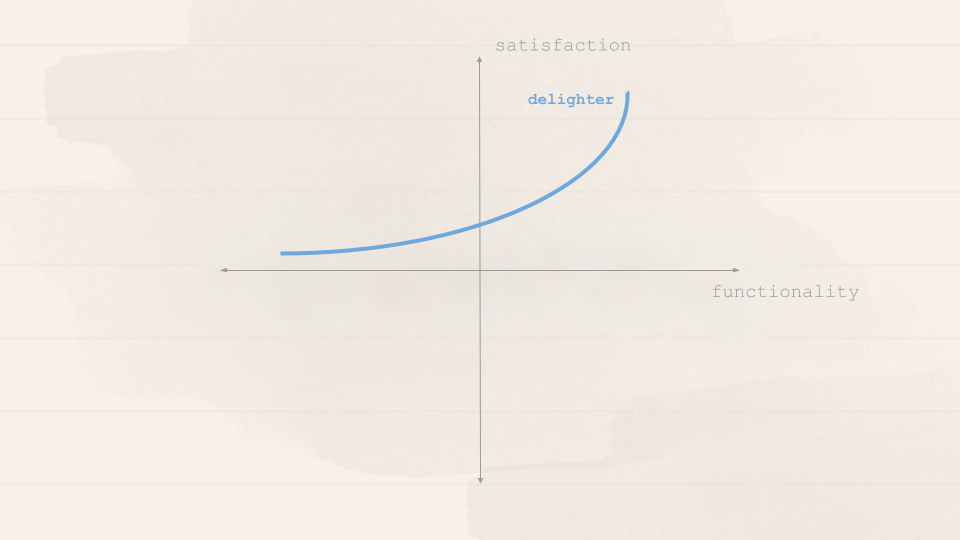
The first time we used an iPhone, we were not expecting such a fluid touchscreen interface, and it blew us away. Think of the first time you used Google Maps or Google Docs. You know, that feeling you get when experiencing something beyond what you expect and know from similar products.
Just remember that our brains don’t have to explode for something to fall under this category. It is anything that makes you go: “Hey, that’s nice!”.
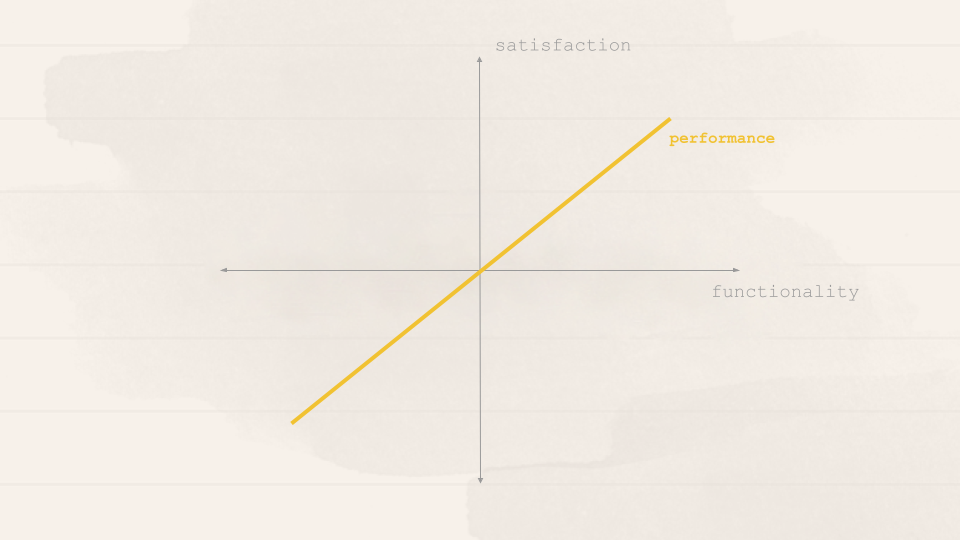
Performance features
The more you provide of this feature, the more satisfied your users become. When you’re buying a car, its gas mileage is usually a Performance attribute. Other examples might be your internet connection speed; laptop battery life; or the storage space in your Dropbox account. The more you have of each of those, the greater your satisfaction.
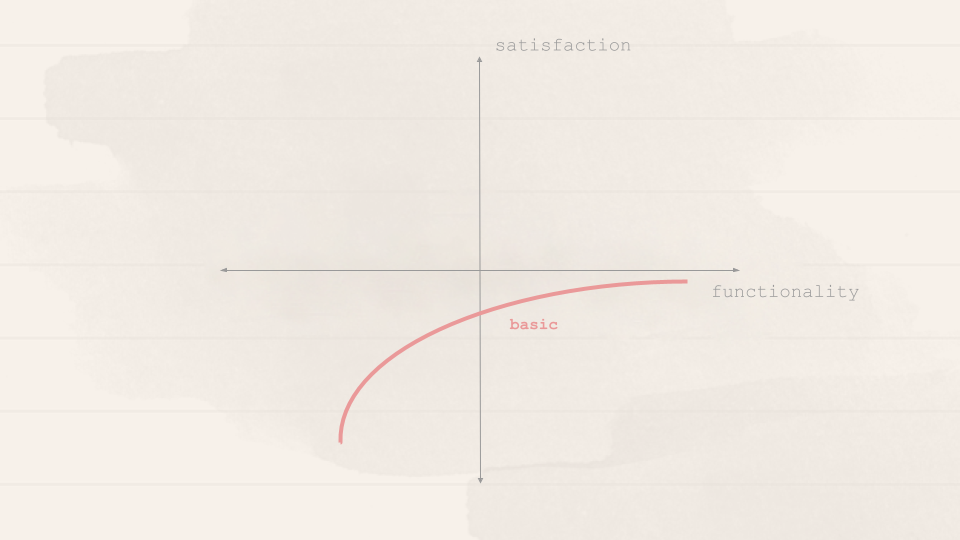
Basic features
Some features are simply expected by users. If your product doesn’t have them, it will be considered incomplete or just plain bad. These are Basics.
Here’s the deal with these features: You need to have them, but that won’t make your users more satisfied. They just won’t be dissatisfied.
We expect our phones to be able to make calls. Our hotel room should have running water and a bed. The car should have brakes. Having any of these won’t make us happy, but lacking them will definitely make us angry towards the product.
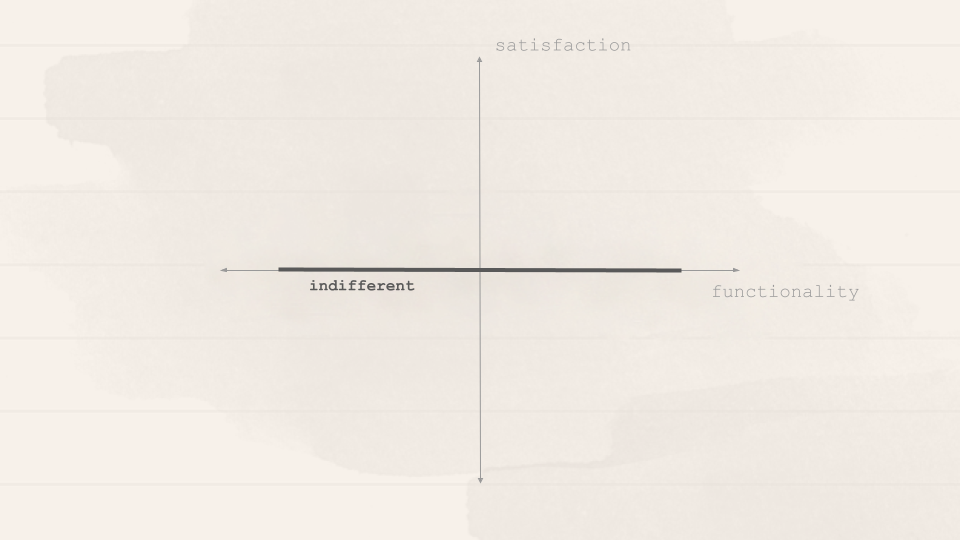
Indifferent
Last, some feature’s presence (or absence) don’t make a real difference in our reaction to the product. You should avoid working on these features, because they’re time (and thus money) sinks.
The natural decay of delight: Now that we have a picture of all the categories a feature can have in KANO, it’s important to take note of a fundamental fact: In which category a feature falls is not static — it changes over time.
Consider the iPhone: It blew us away in 2007 and was a clear Delighter. But by today, we expect our phones to be smartphones and it became a Basic (expectation).
Steps to apply the KANO model
Step 1: Select your target features and users
Which features to analyze (and which not)?
Some features are usually not useful to analyze with KANO such as technical debt, a design system overhaul or features for internal teams such as a reporting system for finance or analytics tool for marketing. Instead, choose features your users will get a meaningful benefit our of, such as a step counter if you’re building a fitness tracker app, or a note function if you’re offering a online psychotherapy course.
Which users to select?
When selecting users to participate in your study, consider some demographic and other cohort or persona data. Otherwise, your data will most likely be all over the map. Imagine you’re working on a B2B SaaS. If you’re considering adding a feature that lets users associate invoices to purchase orders, its attractiveness to a small business is very different to that of an enterprise.
Step 2: Choose questions to ask and run the study
Which questions to ask?
The KANO questionnaire will reveal your user’s attitudes towards your features. This will allow you to categorize each of them as delighter, performer, basic or indifferent. It consists of a pair of questions for each feature we want to evaluate:
One asks your users how they feel if they have the feature (functional form)
The other asks how they feel if they did not have the feature (dysfunctional form)
To each “how do you feel if you had / did not have this feature”, the possible answers are:
I like it
I expect it
I am neutral
I can tolerate it
I dislike it
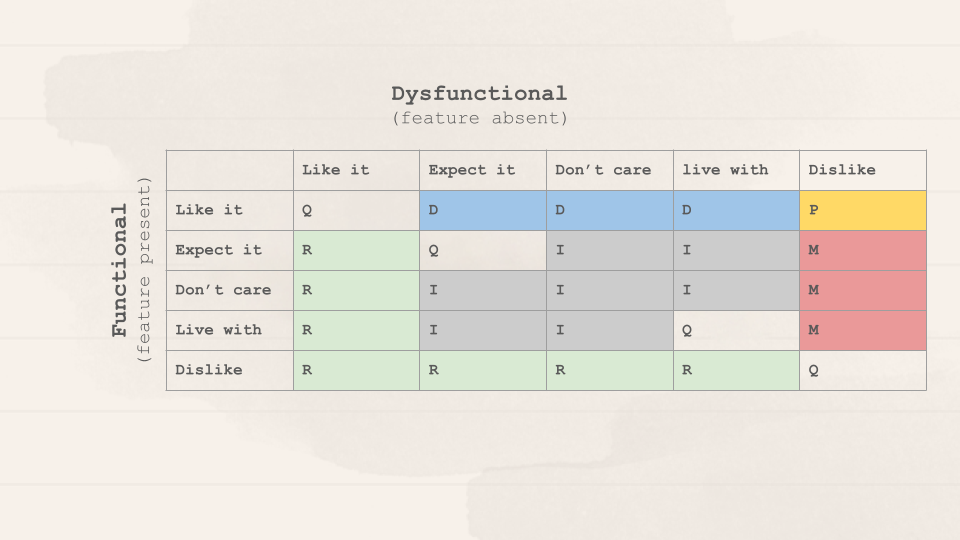
An evaluation table which combines functional and dysfunctional answers gets us to one of the previously described categories (the letters reflect the categories such as D=Delighter). Each answer pair leads to one of the described categories.
Best practices for writing and asking questions
Make your questions clear and succinct. If the feature is complex and requires multiple steps, break the question down.
The form of the question should highlight the benefits to your user and not what the product will be able to do. E.g. “if you can automatically improve how your photo looks, how do you feel?” is better that “if you have the MagicFix™ app, how do you feel?”.
Be careful: the dysfunctional question is not necessarily the opposite of the functional one; it’s just the absence of the functionality. E.g. for a video editing app considering optimizing their exporting speed:
Functional question: “If exporting any video takes under 10 seconds, how do you feel?”
Incorrect dysfunctional question: “If exporting any video takes longer than 10 seconds, how do you feel?”
Preferable dysfunctional question: “If exporting some videos takes longer than 10 seconds, how do you feel?”
Better than explaining features is to show them
Whenever possible, actually show the functionality to the user and then ask how she feels having it or not having it.
Be mindful of the answers’ phrasing and understanding
Maybe the answer scale above doesn’t fit each case. Try these instead:
I enjoy it that way
It is a basic necessity or I expect it that way
I am neutral
I dislike it, but I can live with it that way
I dislike it, and I can’t accept it
Or this one, by Robert Blauth’s team:
This would be very helpful to me
This is a basic requirement for me
This would not affect me
This would be a minor inconvenience
This would be a major problem for me
Be mindful of how these options are interpreted and make sure your users understand the goal of the questionnaire.
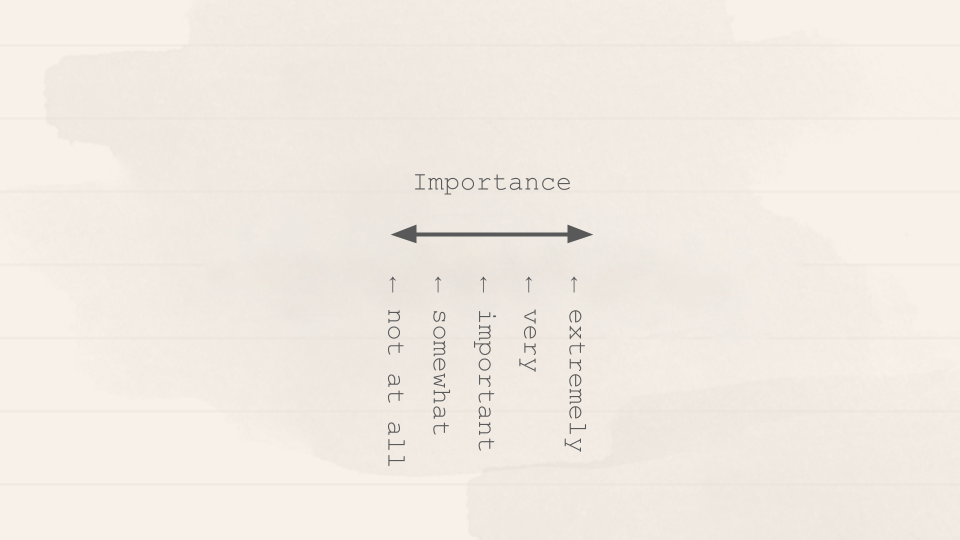
Ask your user about the feature’s importance
One important addition suggested by multiple teams is to include another question after the functional/dysfunctional pair. This question asks users how important a given feature is to them.
This enables you to separate important features from less important ones and how they impact your users’s decisions on the product.
Ask in the following format: “How important is it or would it be if: <requirement>?”. For example, “How important is it or would it be if: exporting videos always takes less than 10 seconds?”.
Responses should be on a scale from 1 to 9, going from ‘Not at all important’ to ‘Extremely important’.
Test your questionnaire
If possible, test your questionnaire with some of your team members, before presenting it to your users. If there’s any internal confusion about it, there will certainly be when talking with people from the outside.
Step 3: Analyze your results
The simplest way we can work through the results is to:
Divide users by the demographic / persona criteria that defines them
Categorize each user’s answers using the evaluation table
Add the responses in each category for each feature (and demographic)
Each feature’s category will be the most frequent response (i.e., the mode)
In case of close results between categories, use the following rule (leftmost wins): Basic > Performance > Delighter > Indifferent
If you’ve asked users for a importance ranking (and you should), average that for each feature
You’ll end up with a table like this one:
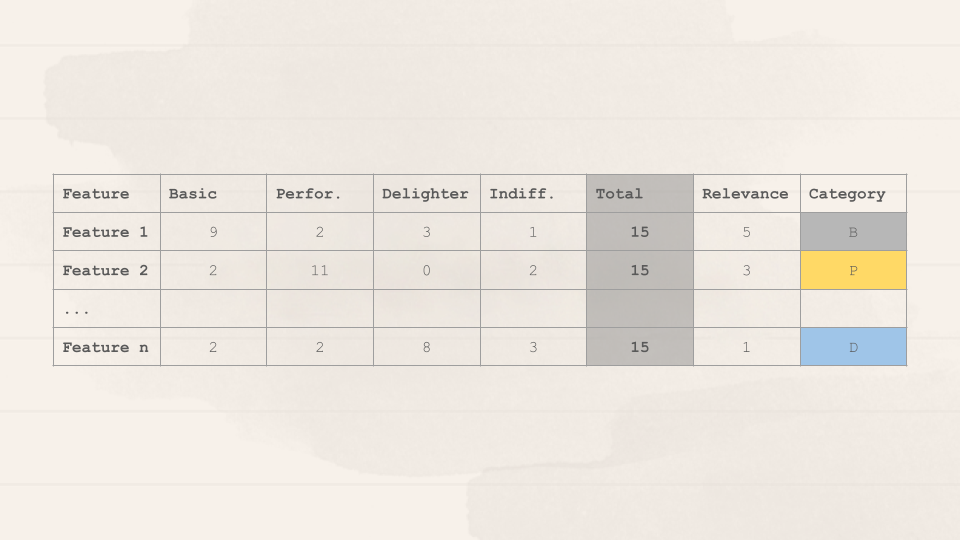
Create your roadmap
From the results table, you can rank features according to their importance. After that, the general rule of thumb to use when prioritizing is to go after all Basic features, then add as many Performance features as you can and finally include a few Delighters.
Further sources:
The Complete Guide to the Kano Model — Folding Burritos
Product backlog prioritization technique: Kano Model | by Reinaldo Camargo | Medium
Got questions, ideas or remarks on this method? Join the conversation on
Slack