RICE
6 min
1+

Once you got your backlog filled with loads of items, how do you decide which to work on first? The guys and girls at Intercom gave us a crisp quantitative method to solve that problem. It’s called RICE. But it’s not the stuff you could eat.
RICE is a quantitative balanced scoring system. With its four factors — Reach, Impact, Confidence, Effort — you can evaluate the priority of any given item .
Your task is to determine the score of each item — the higher the score, the higher its priority. Simple, isn’t it?
The 4 RICE factors explained
Reach

Examples
Idea 1: You database spits out that each month 532,500 new customers sign up. But only 90% of them also activate their account. If your idea tries to increase the number of users activating their account, your reach is 532,500 × 10% = 53,250 customers per month.
Idea 2: Imagine you want to migrate all users to your new system. Currently, 300 users are using the old one. Migrating these users to a new system will have a one-time effect on these 300 existing customers, with no ongoing effect. The reach is 300 users (per month, or whatever time interval you choose).
Why? To avoid bias towards features you might have fallen in love with, estimate how many people each idea will actually affect. Also, make sure to define a time period such as ‘per month’ or ‘per quarter’. This way you can compare the (ongoing) effects between features.
What? Reach is measured in number of users per time period. That might be ‘users per quarter’ or ‘transactions per month’. As much as possible, use real measurements from product metrics instead of pulling numbers from a hat.
Impact

Example
Imagine a new feature has a incredible impact on the retention of the users you reach. Then add a score of 3 for impact on this feature.
Why? Select your target metric, such as ‘Retention’, and try to see how impactful your feature will be to your user in regard to this metric. E.g. “how much will this idea increase retention when a user encounters it?”. This ensures you focus on ideas that actually move your target metrics.
What? Instead of using your gut feeling, try to quantify the impact your feature has on your users. It’s tough, but choose from the multiple-choice scale Intercom provided: 3 = massive impact 2 = high 1 = medium 0.5 = low 0.25 = minimal These numbers get multiplied into the final score to scale it up or down. Given you use OKR, maybe you can actually use the key results on your target metric to determine what exactly “massive impact” means, maybe a 5–8% in retention or something like that. User user research such as prototype testing to add some flesh to your estimate.
Confidence

Examples
Idea 1: We have quantitative metrics for reach, user research for impact, and an engineering estimate for effort. This project gets a 100% confidence score.
Idea 2: We build a new feature, which is not yet out there in the market, and we don’t know how users react. Reach and impact may be lower than estimated — there is no data in the market to back it up. But our engineers know roughly how much effort it needs to chip it out. This project gets a 50% confidence score, maybe 60%.
Why? To assess how confident you actually are about the numbers you added, make sure to add a honest assessment on how much of your estimations are actually gut-based vs. data-backed. Be honest with yourself: how much support do you really have for your estimates?
What? Use this scale Intercom provides to help avoid decision paralysis. 100% = high confidence 80% = medium 50% = low <50% = moonshot Find out: Does your database back up your ‘reach’ estimates? Can your engineers provide a proper estimate on complexity or effort? Do you have data from user research or competition analysis at hand to validate your impact scores?
Effort

Example
Idea 1: This will take about a week of planning, 1–2 weeks of design, and 2–4 weeks of engineering time. I’ll give it an effort score of 2 person-months.
Idea 2: Engineering and design gave 8 complexity points on this. So, add an 8.
Why? Obviously, you only got limited resources. So, you want to spend them wisely on the ideas that reap the highest reward at the lowest cost. Estimate the total amount of time or — even better — complexity a project will require from all members of your team: product, design and engineering.
What? Effort is estimated as a number of person-months (the work that one team member can do in a month) or complexity/story points. If you use story points to measure effort you automatically adjust for uncertainty. You can use a Magic Estimation Workshop to determine the complexity (read the article here). Just make sure to be consistent with the effort measure you use.
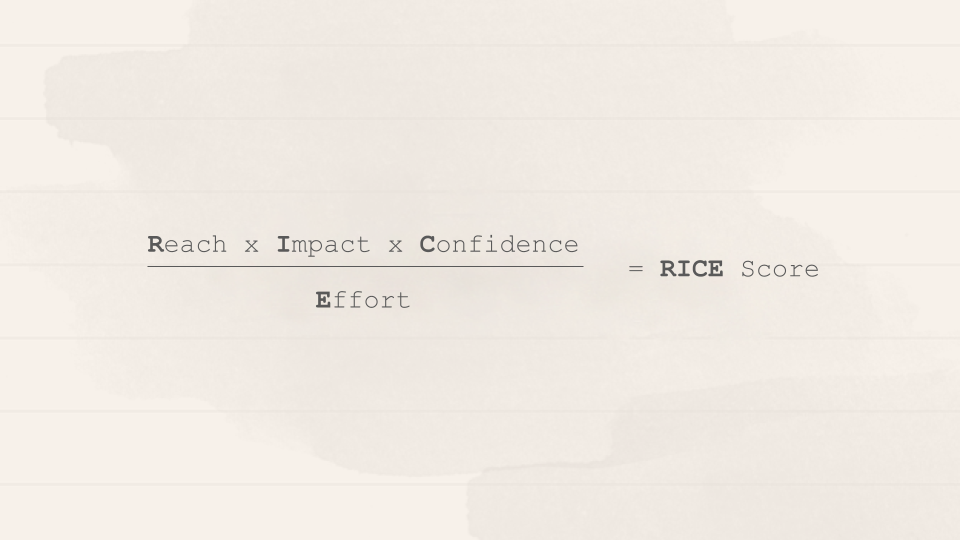
Finally, calculate the score…
…using this simple formula:
Intercom also set up a spreadsheet to automatically calculate the score for you as youestimate each factor. Feel free to duplicate the sheet for your own use. Or download an .xls version.
After setting up the sheet, make sure to do a sanity check. Is there something odd in your prioritization? If so, reconsider your estimates, make changes, or accept that your gut instinct may be wrong.
Post Scriptum
"Of course, RICE scores shouldn’t be used as a hard and fast rule. There are many reasons why you might work on a project with a lower score first. One project may be a dependency for another project, so it needs to happen first, or another feature might be “table stakes” to sell to certain customers.
Sometimes you might want or need to work on projects “out of order”. And that’s okay! With a scoring system in place, you can clearly identify when you’re making these trade-offs.
A prioritization framework such as RICE will help you make better-informed decisions about what to work on first and defend those decisions to others. Give RICE a try in your own prioritization process and let us know how it works for you." - Intercom
RICE Prioritization Framework for Product Managers [+Examples] Prioritization is a perennial challenge when building a product roadmap. How do you decide what to work on first? If…www.intercom.com
Got questions, ideas or remarks on this method? Join the conversation on